Social networks local visualization
Recently I discover vizster, an academic project (written by a Stanford’s professor and a recent Berkeley PhD), devoted to the visualization of local portions of a social network graph. Since I wrote a software to automatically draw graphs too, I wanted to see how much a specific software could overcome mine.
Since I don’t have any actual social graph in my hands, the only test I can do is with the very local social graph of my acquaintances on the social network I use the most, Facebook (I’m sure they needed this PageRank). To speed up the test, I also learned how to write a simple application with pyFacebook, in order to download and build the graph. This proved to be a very pleasant experience (with less than ten calls I reached my goal). The graph consists of my Facebook friends and their connections, it doesn’t count their mutual friends outside my reach.
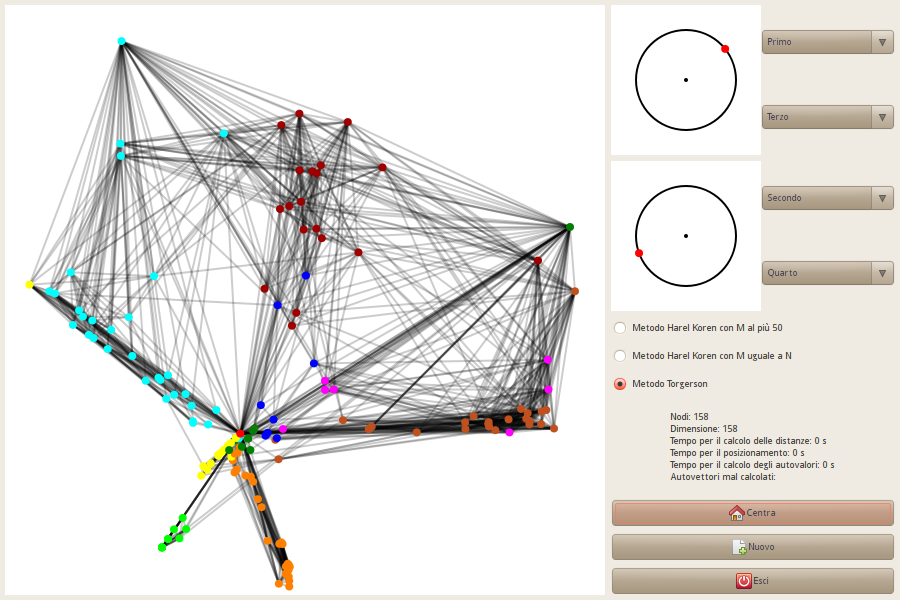
So, plugging the graph to vizster and to NetViz, these were the results.
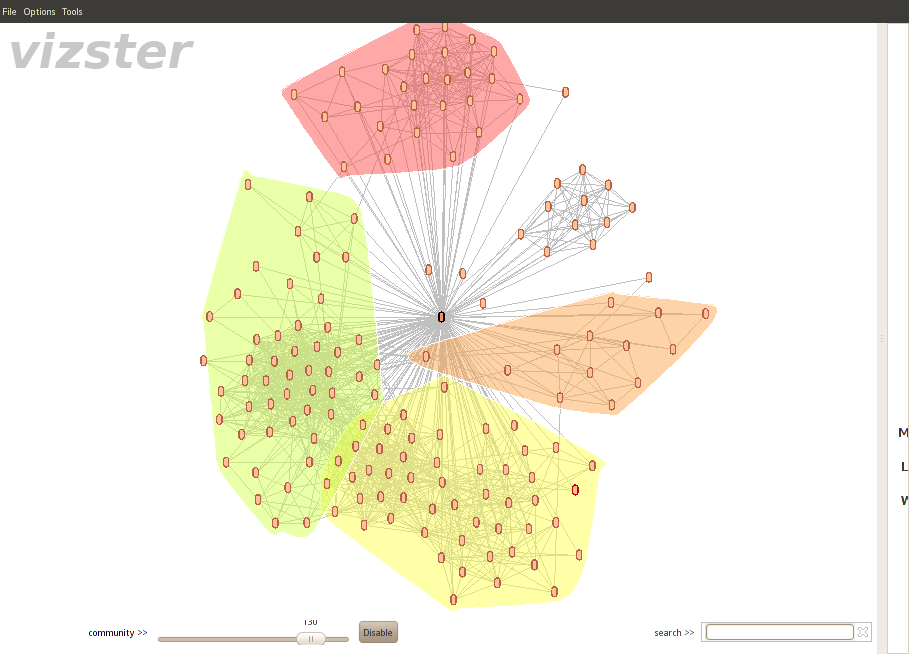
A quick explanation. vizster uses some kind of spring model (so the position evolves with times and friendship relations pull points together); also, it clusters points; it is not perfect but tweaking the parameter you see in the bottom, it is pretty acceptable. I think the clusterization does not use the position in the drawing, but just the raw graph data.
Instead, NetViz disposes the points optimally in a high-dimension space and then tries to find a good two-dimensional plane where to project the points, basing on the distribution of the coordinates’ values. The colors were not computed by NetViz, but was inserted by me manually to check how well it was working.
What is obvious is that vizster is a much better way to display the clusters, since with my software, people in the same community end up being almost collinear (the smallest the community, the shorter the line). This is explainable by the fact that the most useful directions are the one discerning the clusters, while the people inside one cluster are almost equal considering those directions. Something that NetViz does better is to highlight the “closest friends”, that is, those people who have contacts in many of the clusters. Where vizster put these people almost randomly, NetViz places them clearly outside the clusters and in a prominent position.
My feeling is that with this kind of inputs, a double step process could improve a lot NetViz’s performances (which does the best for graphs that resemble a mesh); for example, after placing the points using the current algorithm, one could detect the clusters by looking at the lines departing from the center and then trying to dispose the points running the same algorithm cluster by cluster. Surely this goes in my (long) todo list.