NetViz
Written on December 15, 2008
NetViz is an indirect graph viewer that tries to show the (n) dimensional structure rather than optimize the graph locally.
Indeed, instead of softwares which use physic or probabilistic models (e.g. simulated annealing) to optimize a function based on vertex distances, angles between edges and so on, to find a vertex disposition it does the following:
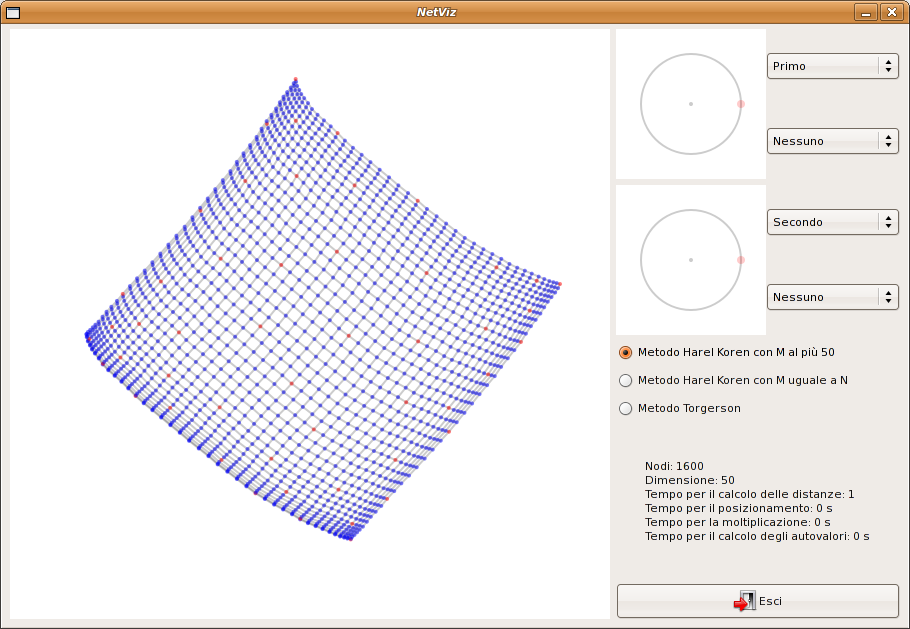
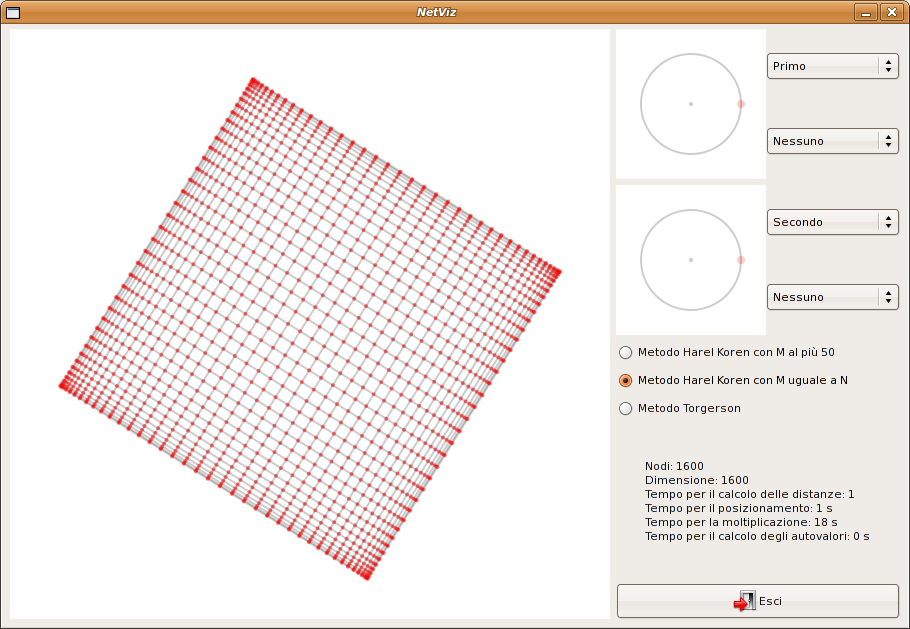
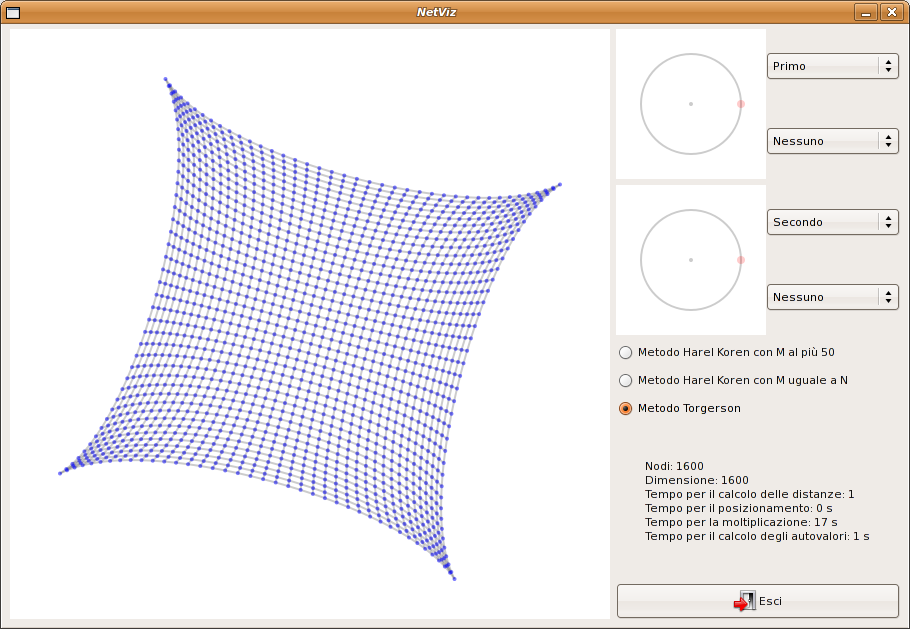
- draw the graph in a high dimensional space (in the various methods, from some dozens to the number of nodes), that is much easier than to draw directly in two dimension; to place the vertex, it chooses some vertex as pivot (maybe all) and couple them with a direction; after that, the coordinate of a vertex in that direction will be a function of its distance from the pivot;
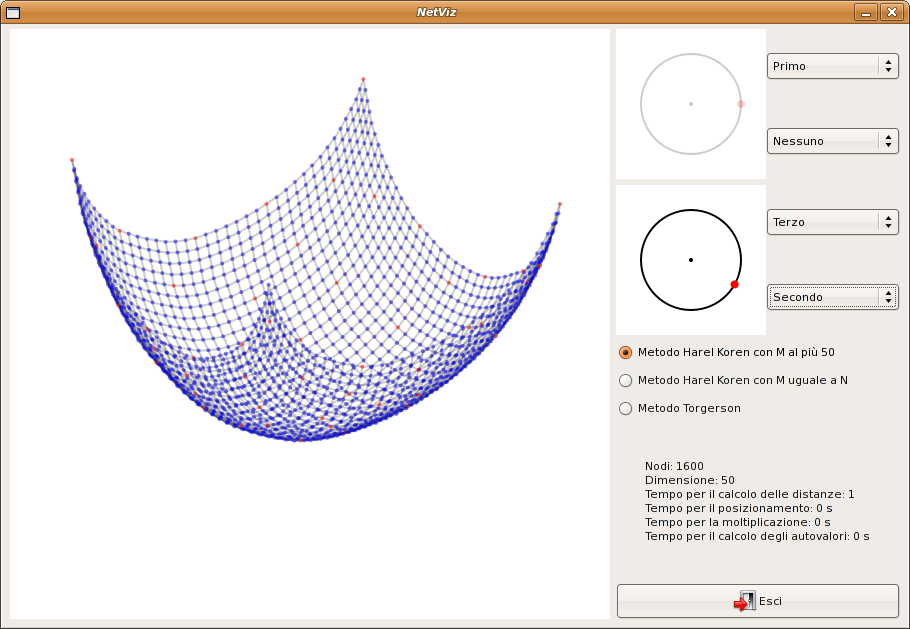
- finds an optimal projection, that supposes to be one that maximise the variance between vertices; it is proved that it’s the same to project on the eigenvectors with maximal eigenvalues (you can project on any two linear combination of the first four eigenvectors, if the automatic choice isn’t so good) of the matrix MMt, where the columns of M are the coordinates of the vertices in high dimension.
Some screenshots.

The latest version if 0.5, of the 9th June, 2007. You can download it here.