pydepgraph – A dependencies analyzer for Python
I just started a new repository in my GitHub account, storing a small utility to display the dependency graph of a Python project. This post will show some examples and possible uses.
First of all, to install pydepgraph you just need to clone the repository and install the package, with the commands
git clone https://stefano-maggiolo@github.com/stefano-maggiolo/pydepgraph.git
cd pydepgraph
sudo ./setup.py install
and you are ready to use it. To display the graphs, you should also install dot from Graphviz, since pydepgraph’s output is to be visualized with this tool.
Now we are ready to show something. Let’s start with pyzmq, the Python bindings for libzmq. Since usually the dependencies graphs are quite big, we first draw the dependencies grouped in clusters, that is, in sub-packages. We can specify which cluster we want, but here we let pydepgraph choose them by itself.
pydepgraph -p pyzmq -g 2 | dot -Tpng -o graph.png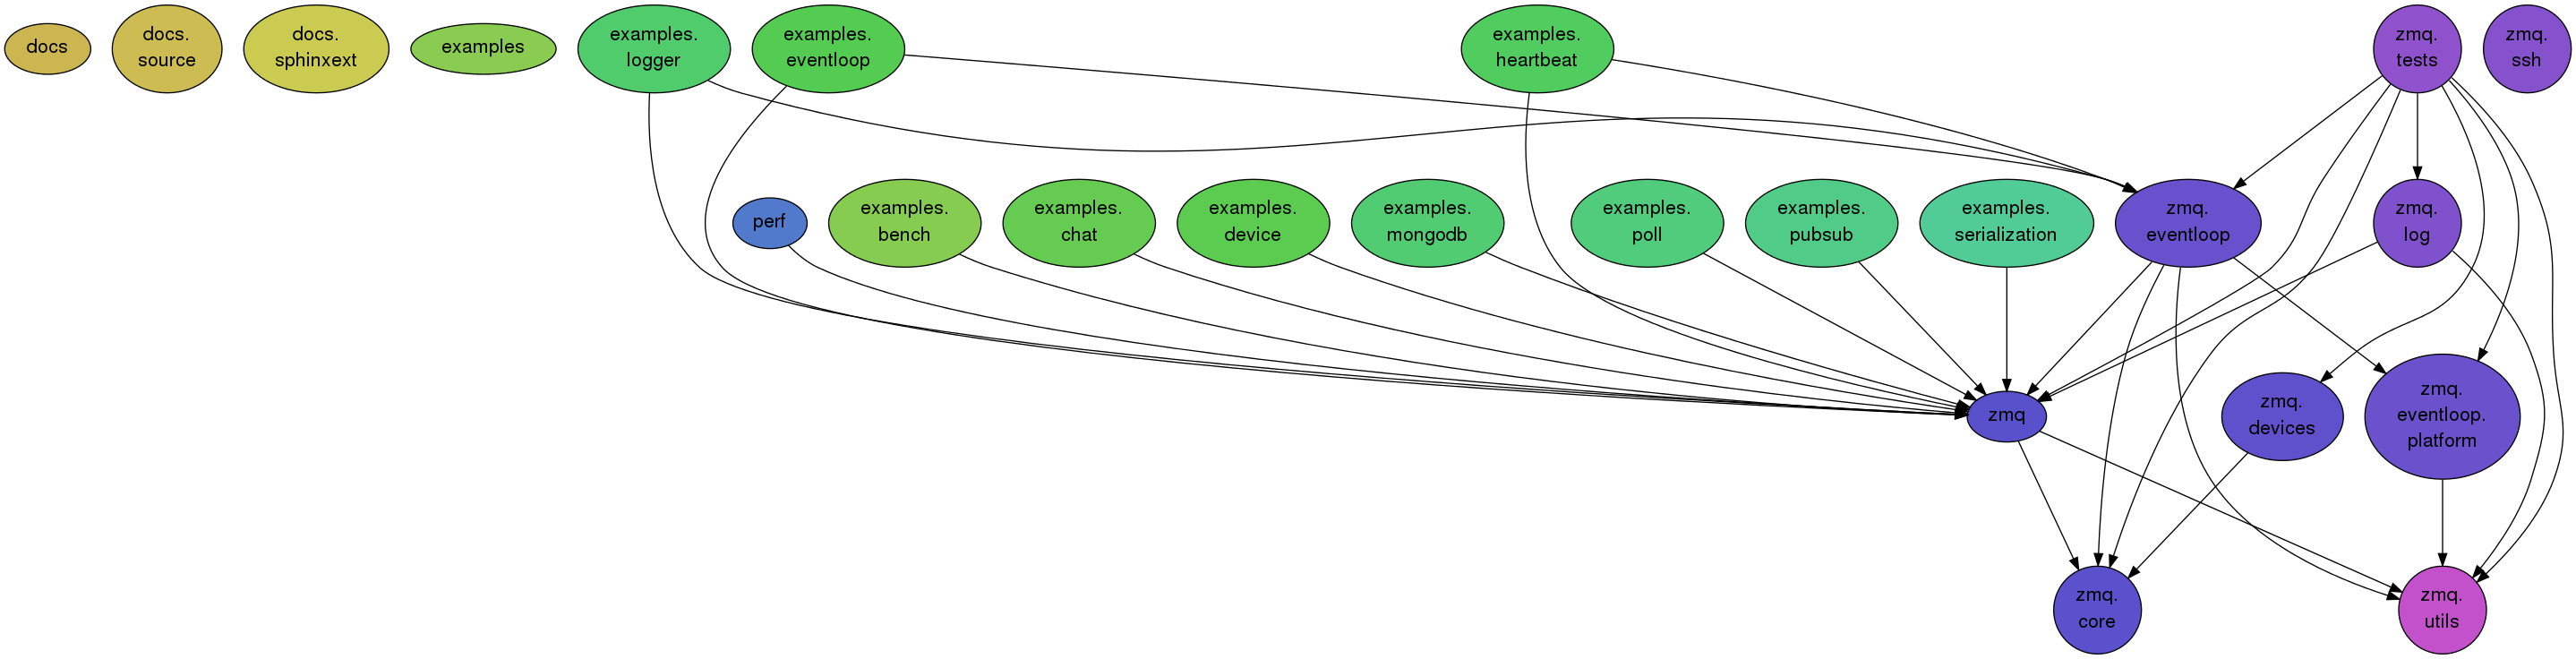
With those options, we just specified the path we want to analyze (multiple paths can be inserted, comma-separated) and the type of graph we wanted, with these meaning:
0, for the graph of all modules, without any clustering;1, for the graph of all modules, enclosed in clusters;2, for the graph of all clusters, without self-edges;3, for the graph of all clusters.
Note that the paths need to be the roots of the projects in order for pydepgraph to find the correct imports. This may change in the future to allow sub-project inspections.
The output is cluttered with the many (and not very informative) clusters in examples and docs, but we can hide them using the -e switch that stands for exclude and remove all modules whose path contains one of the comma-separated value in the switch.
pydepgraph -p pyzmq -e examples,docs -g 2 | dot -Tpng -o graph.png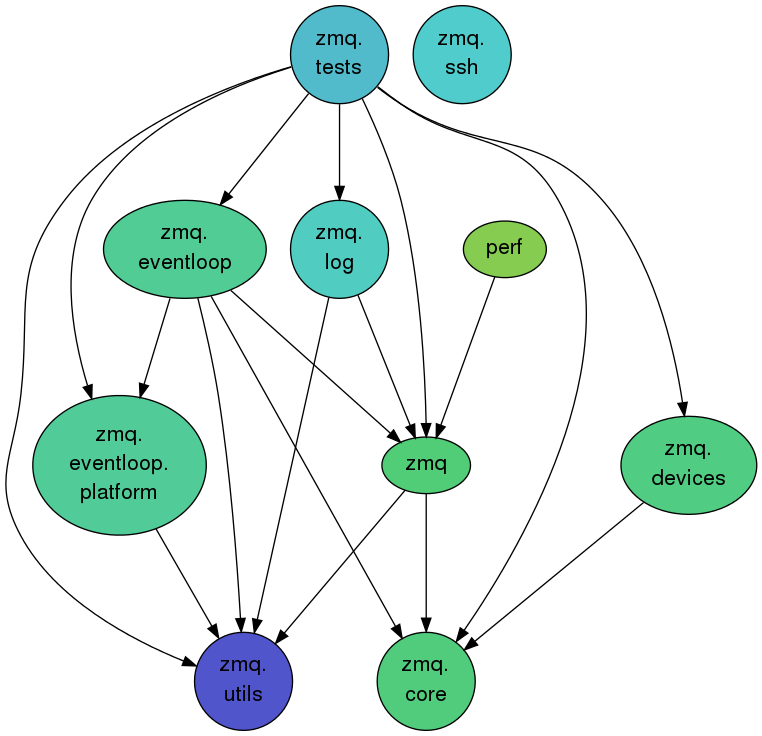
So we obtained a nice, loop-free graph of the main components of pyzmq, but we can look in more details at all the modules (removing some more non-informative pieces).
pydepgraph -p pyzmq -e examples,docs,tests,setupegg.py,zmqversion.py,setup.py,buildutils.py -g 1 | dot -Tpng -o graph.png
Let us consider another example, pip: we start with the cluster representation (avoiding docs and tests).
pydepgraph -p pip -e docs,tests -g 2 | dot -Tpng -o graph.png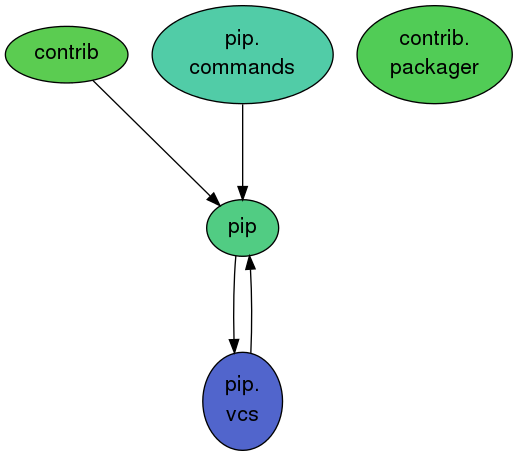
Where we can observe a loop between pip and pip.vcs. Going to the details, we look at the non-clustered view of the modules (removing some more to simplify the view).
pydepgraph -p pip -e docs,tests,commands,contrib,setup.py -g 0 | dot -Tpng -o graph.png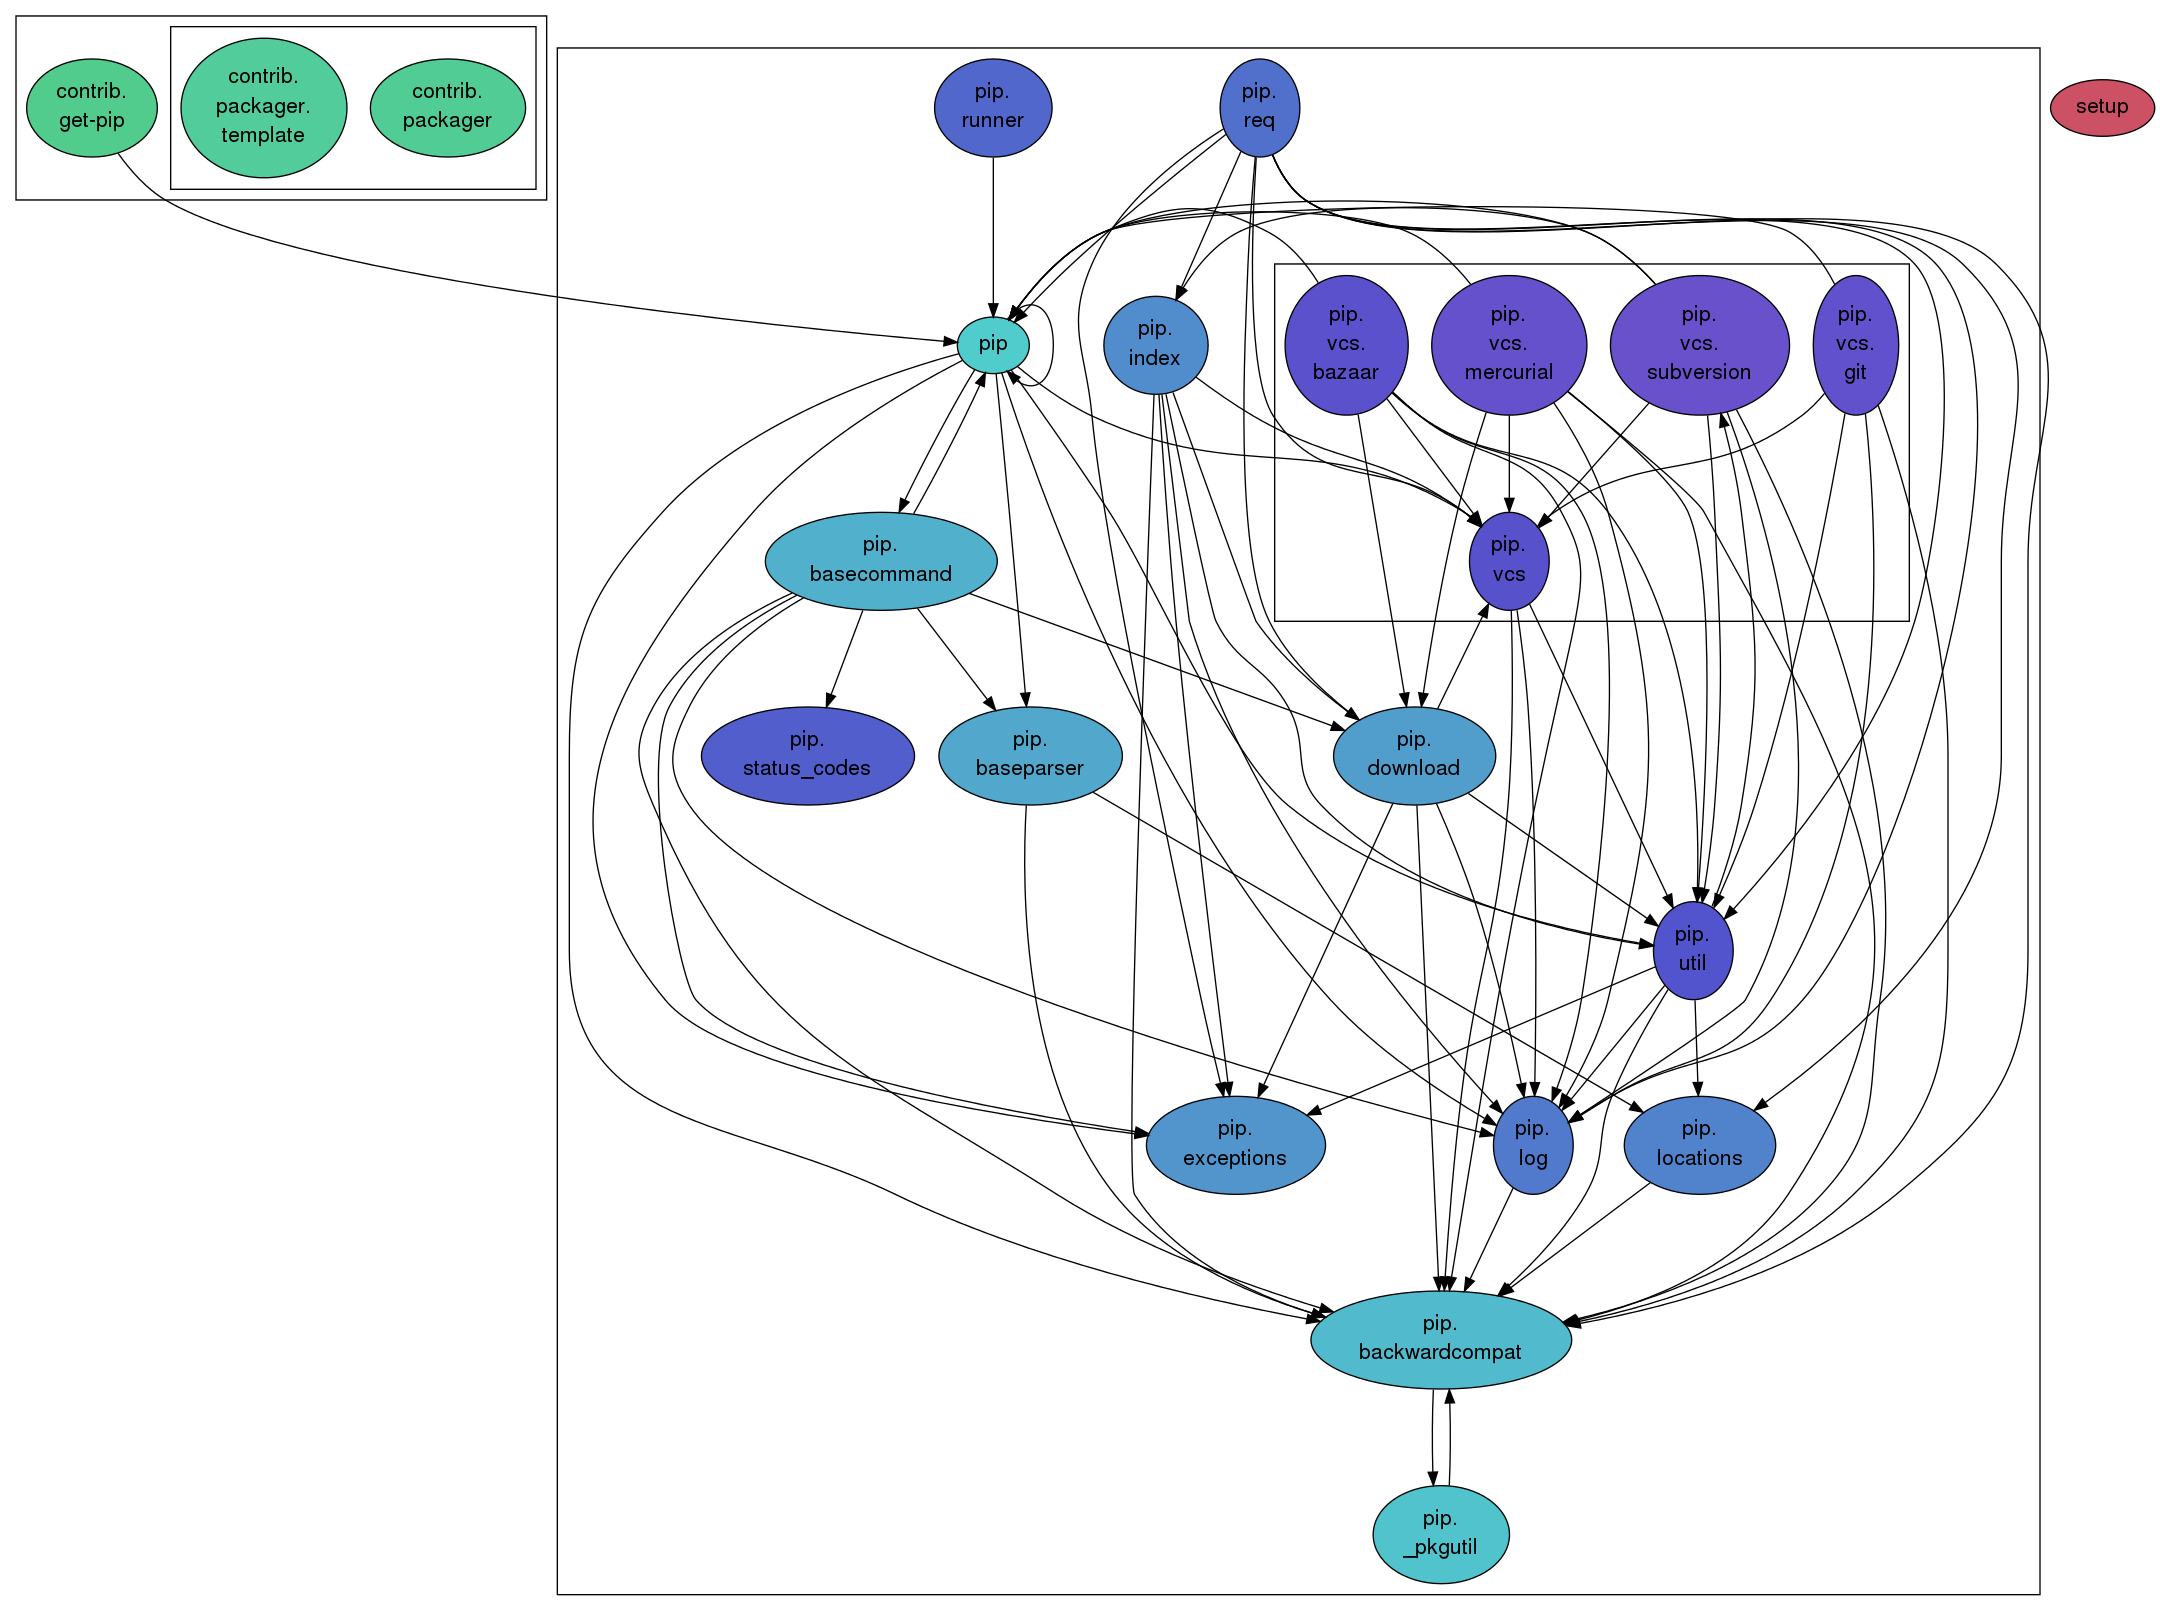
Using this view, we can find out of place modules and other things to reorganize, even though obtaining a nice graph in this way is quite difficult. But pyzmq manages to have a nice graph.
pydepgraph -p pyzmq -e examples,docs,tests,setupegg.py,zmqversion.py,setup.py,buildutils.py -g 0 | dot -Tpng -o graph.png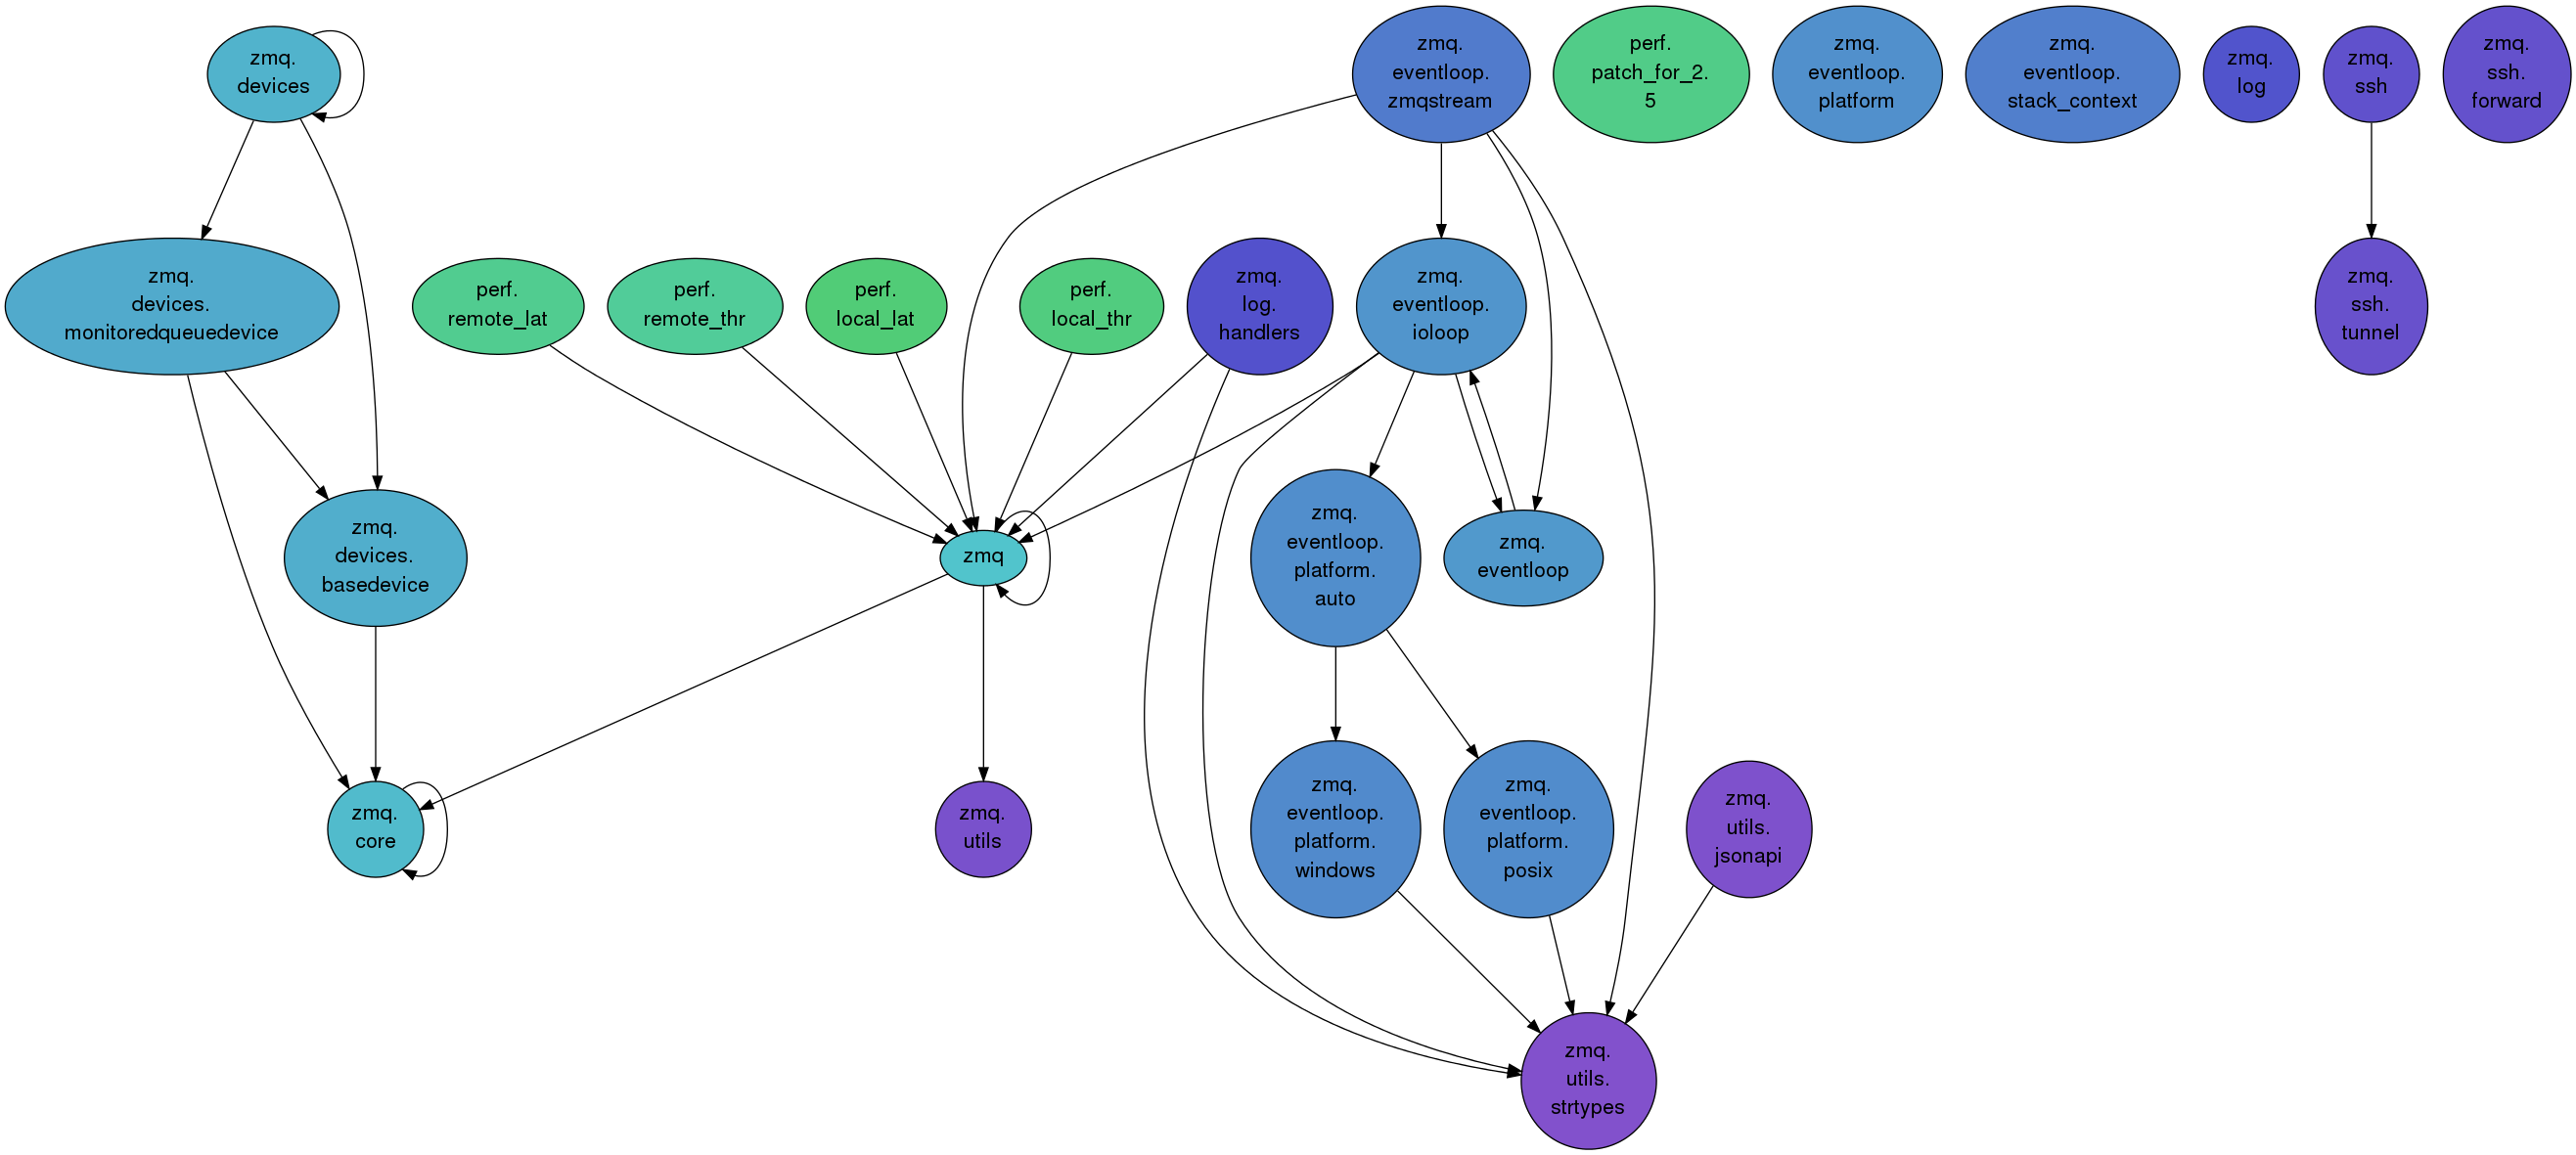
Let us take a look at tornado main structure. We want a clustered view, but pydepgraph would find too many clusters for this project, so we specify the comma-separated list of the clusters we like to see with the -c switch.
pydepgraph -p tornado -c demos,tornado,tornado.platform,maint,website.tornado,website,tornado.test -g 2 | dot -Tpng -o graph.png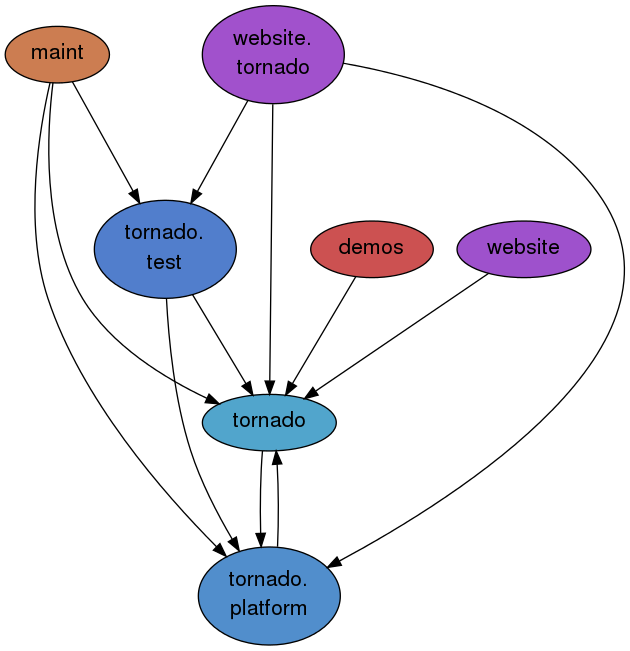
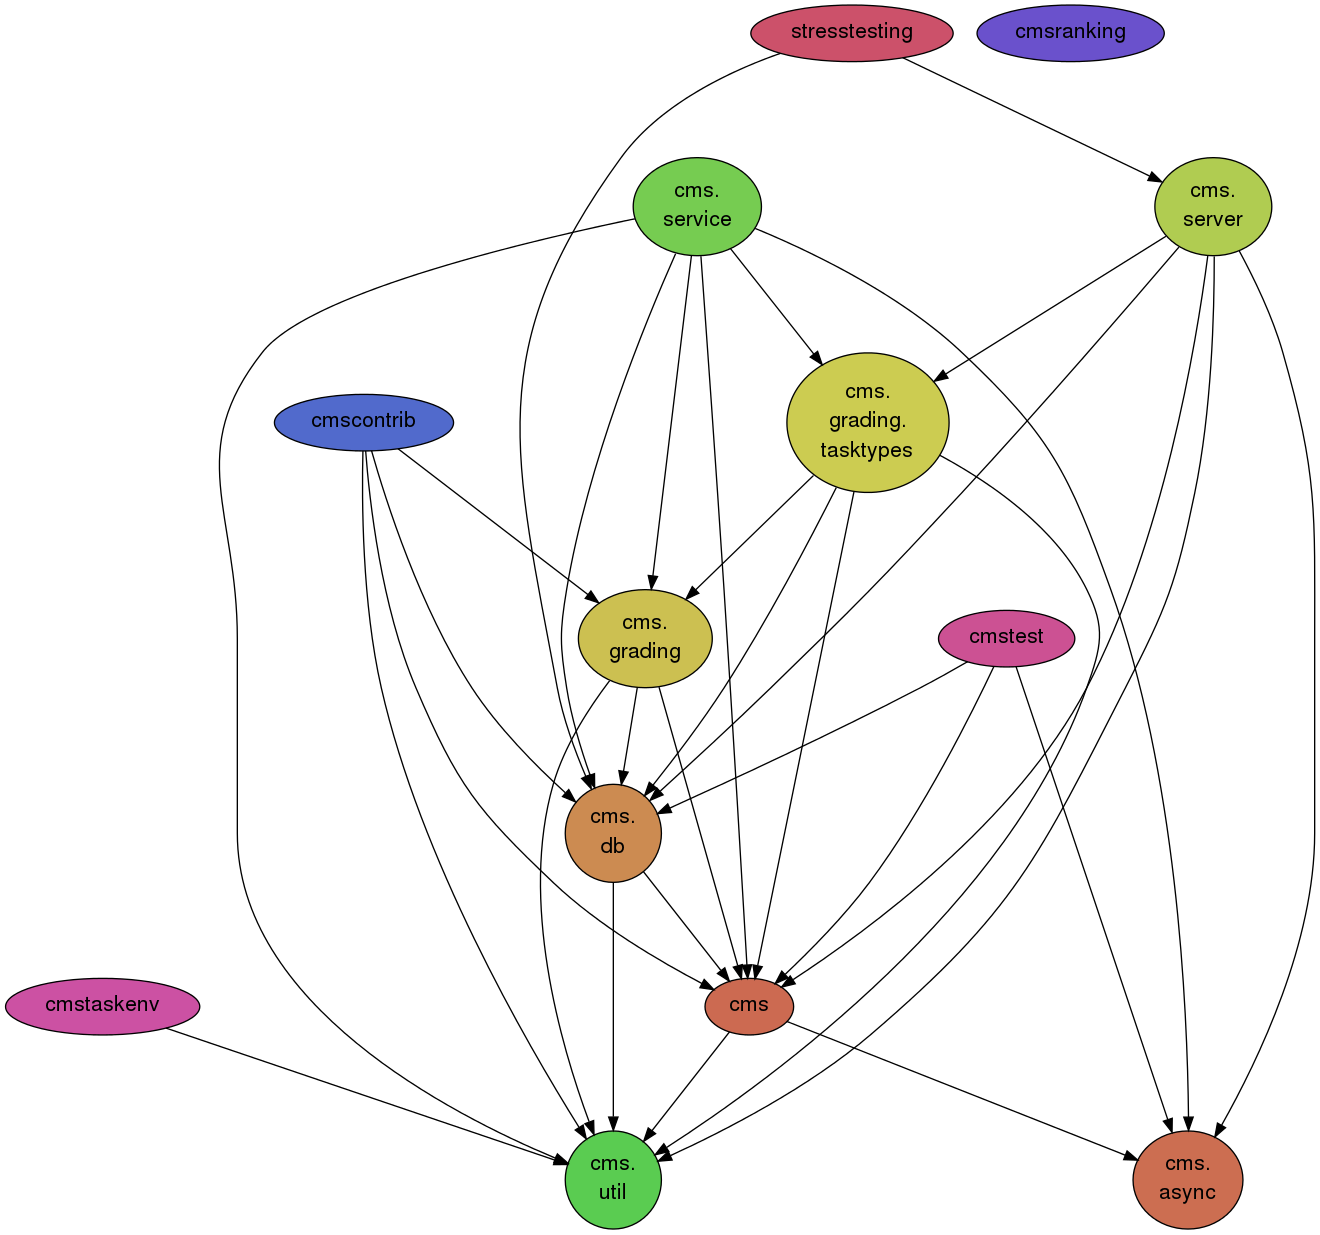
And finally, here is the cluster graph of CMS, the project I am currently working on. I just avoided the building directories created by setuptools.
pydepgraph -p cms -e build,cms.egg-info,dist -g 2 | dot -Tpng -o