On the distribution of Italian towns by their endings
Unlike many other countries (like the US) where the majority of towns was funded in recent times (less than three or four hundreds of year ago), most towns in Italy have more than a thousand years, and many a lot more. For example, according to the legend, Rome has 2765 years.
This simple difference leads to two very dissimilar naming scheme for, e.g., US and Italy: for example, many cities in the US are named using variations of pre-existing cities names, often from all around the world (there are at least four Venice in the US); whereas, in Italy, the names of cities often comes from cultures that are nowadays lost in legends, but more important from cultures that were very local.
It is often easy for an Italian to be able to place a city in its region just hearing the name. For example, a town like Limbiate is very likely placed in the territory north to Milan. If we look in the neighborhood of Limbiate, we find many other cities like Brembate, Lazzate, Olgiate, Carate, …. So it is clear what is the distinctive trait: the ending of the name. “–ate” is indeed an ending of celtic origin, meaning “(the territory) of –”, but also it is the ending of the word “wall”. The most common ending for an Italian town is “–ano”, followed by the truncation “–an”, meaning “(terrain) of –” in Latin. Whereas towns ending in “–ate” are very localized in the north of Italy, the ones ending in “–ano” are spread throughout the country.
So, the project started downloading names, latitude and longitude of (almost) all about eight thousand Italian towns, using Wikipedia’s lists. The precise number is 8019 towns. The endings, which should start from the stressed letter, are computed instead in an approximated way (basically, they start from the last vowel before the last group of consonants).
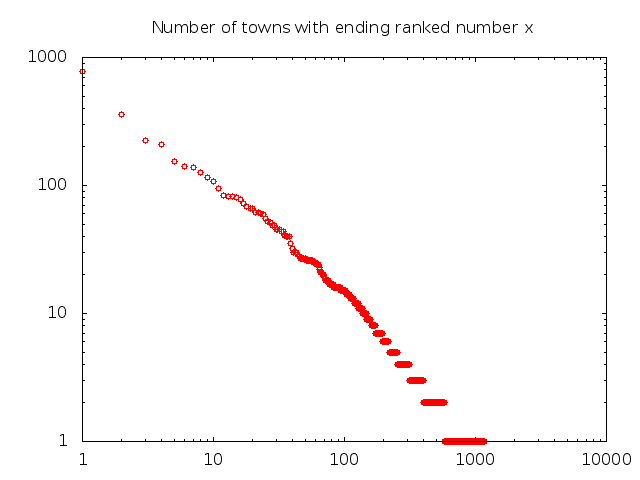
The first observation is that if we sort the endings by their number of towns, we obtain an almost perfect power law distribution, as expected (here in the plot the axes are logarithmic, hence a perfect power law is just a straight line).
I was curious about the most localized endings. The first thing one can try is to find the endings whose average longitude is very high or very low.
This because I expected that the most localized endings came from Celts and Gauls in the north, and Greeks in the south. Only the first expectations turned out to be true, indeed there are many endings very local in the north part of Italy: “–ate”, “–engo”, “–es”, “–on”, “–ago”, etc. The same is not true for the south part of Italy. The same analysis in the east-west direction reveales also endings common in Sardinia. It is interesting to notice that one of the most common ending in the isle is “–is”, which has a strong presence also in the north-east part of Italy, probably for completely different reasons.
A more refined way to find localized endings is to look at the variance. The problem is the presence of many outliers, that is, towns with the same ending but very isolated from the mean. This problem is somehow reduced if we consider the so called absolute deviation instead of the standard deviation. One can also look at some combination of the variances (or the absolute deviations) for the two directions, and this works also well because Italy has south-north and west-east as the two principal directions, but nevertheless we have no better insight than using the two dimensional version.

There is still one problem though, that is the one of Sardinia and Friuli-Venezia Giulia (the north-east region) sharing the same ending “–is”. Using a plain statistical measure will consider the two very localized communities as a non-local one, so the idea is to apply a clustering algorithm and then use as the “score” an (algebraic) combination of the sum of variances of the clusters, the variance of the whole population, and the number of cluster needed. I decided to settle to use as the score the product of the total variance, the sum of variances to the 3/2 and the number of clusters, so I gave more importance to the sum of variances of the clusters.
As a sign that the last method is better, we can see that the endings that are common both in Sardinia and in Friuli-Venezia Giulia have gained some positions with respect to the ranking computed using variance only.
Software used: BeautifulSoup to scrap the coordinates from Wikipedia’s page, matplotlib with Basemap to draw the maps, ImageMagick to build the gif files, sklearn for the implementation of the DBSCAN algorithm to split the towns in clusters.